
Welcome to our blog for specialty coffee roasters! In this FARMly space, we will explore a topic crucial to the success of your business: how to use financial metrics and indicators to evaluate the performance of your business.
In this blog, we will explore several financial metrics and indicators that can provide valuable information about your business performance. We will discuss the importance of monitoring total revenue, gross profit margin, cost of production per unit, net profit margin, return on investment, break-even point, and many other relevant financial indicators.
How to Use Key Metrics and Indicators Effectively in Your Business
1 – Total Revenue
Total revenue is a key indicator to evaluate the financial performance of your business. It represents the total value of sales and directly reflects the demand for your specialty coffees. Tracking and analyzing total revenue is essential to understand the financial health of your business and to make strategic decisions.
Track revenue over time:
Record and track your business’s total revenue regularly, month to month or quarter to quarter. This will allow you to identify seasonal patterns, growth trends, or significant variations over time.
Analyze revenue sources:
Identify the different sources of revenue for your business, such as direct sales to consumers, sales to coffee shops, online sales, or even partnerships with distributors. Analyze each source’s contribution to total revenue and identify those that are most significant.
Segment revenue by product or category:
If you offer different types of specialty coffees or related products, segment revenue by product or category. This will allow you to identify which products are in greatest demand and contribute most to total revenue. This information can be useful in directing your marketing and product development efforts.
Compare revenue to costs:
Evaluate the relationship between total revenue and the costs associated with producing specialty coffees. Make sure that the revenue is sufficient to cover all direct and indirect costs, such as the cost of coffee beans, roasting costs, packaging, marketing, and overhead. This analysis will help determine the profitability of your business.
Track performance against goals:
Set revenue goals for your business and track your progress against those goals. This will allow you to evaluate the performance of your business and make adjustments when necessary. If revenue is below targets, you may want to consider implementing additional marketing strategies or expanding into new markets.
Make projections and forecasts:
Use historical revenue data to make future projections and forecasts. This will help you identify growth opportunities, predict seasonal fluctuations, and make strategic decisions to boost your business revenue.
2 – Gross Profit Margin
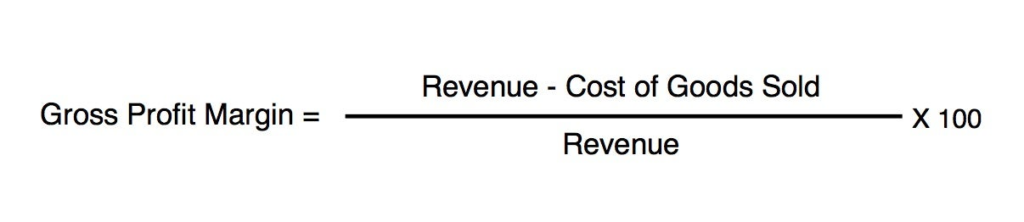
Gross profit margin is an important financial metric that indicates the profitability of your coffee roaster. It represents the difference between total revenue and the direct costs associated with producing specialty coffees, such as the cost of the coffee beans and roasting costs. The gross profit margin is expressed as a percentage and is calculated as follows:
Gross Profit Margin = (Total Revenue – Cost of Coffee Beans – Roasting Costs) / Total Revenue * 100
Calculate and monitor the gross profit margin regularly:
Perform gross profit margin calculation at regular intervals, such as monthly or quarterly. Tracking these metrics over time will help identify trends and significant variations in the profitability of your business.
Compare the gross profit margin to the industry benchmark:
Research and analyze the average gross profit margin of the specialty coffee roasting industry. This will allow you to compare your business performance to the overall market performance and identify areas where you can improve.
Identify the key profit margin drivers:
Analyze the different components that affect gross profit margin, such as variations in the price of coffee beans, the efficiency of roasting processes, cost control, and sales volume. Identifying the key drivers will help direct your efforts to improve profitability.
Adjust product prices if necessary:
If the gross profit margin is below expectations or the industry benchmark, you may consider adjusting the prices of your specialty coffees. Evaluate market demand, customer perceptions of value, and competition to determine if a price adjustment is feasible.
Look for efficiencies in production processes:
Identify opportunities to optimize production processes and reduce direct costs, such as using coffee beans efficiently, controlling quality during roasting, and minimizing waste. This will contribute to a healthier gross profit margin.
Evaluate the profitability of each product:
Calculate the gross profit margin individually for each product or specialty coffee category you offer. This will help you identify which products are most profitable and which may require adjustments in costs or selling price.
3 – Production Cost per Unit
The cost of production per unit is an important financial metric for understanding the cost involved in producing each unit of specialty coffee. This metric allows you to get a clear picture of the direct costs associated with production, such as the coffee beans, roasting costs, packaging, and other materials used in the process.
Calculate the cost of production per unit:
To calculate the cost of production per unit, you need to add up all the direct costs involved in producing each unit of specialty coffee and divide by the total number of units produced. These costs include the cost of the coffee beans, roasting costs, packaging, labels, and any other materials used in production. This will give you an accurate picture of the costs involved in each unit of coffee produced.
Track production costs regularly:
It is important to regularly track and update per-unit production costs as the costs of raw materials and other inputs can vary over time. Keep up-to-date records of costs and review them periodically to ensure that your analysis and decisions are based on accurate information.
Identify opportunities to reduce costs:
Analyze the different components of the cost of production per unit and identify opportunities to reduce costs. This may include optimizing roasting processes to minimize waste, negotiating packaging discounts, or finding cheaper alternatives for packaging materials.
Adjust the sales price according to the cost of production:
The cost of production per unit provides a solid basis for determining the selling price of your specialty coffees. Make sure that the selling price is sufficient to cover all costs of production as well as other indirect costs such as administrative expenses, marketing, and desired profit margin. Also, take into account the customers’ perception of value and market analysis when setting the sales price.
Keep track of the variation in production costs:
Keep an eye on possible variations in production costs. This can include fluctuations in the price of coffee beans due to factors such as weather conditions, market demand, or currency fluctuations. By monitoring and anticipating these variations, you will be prepared to adjust your financial planning and pricing strategies.
Make comparisons with the competition:
Analyze your competitors’ unit production costs to assess their position in the market. This will allow you to identify opportunities for improvement and determine whether your costs are in line with the industry average. If your production costs are significantly higher, look for ways to reduce them or find ways to add value to your products to justify higher prices.
4 – Net Profit Margin
Net profit margin is a key financial metric that indicates the percentage of each monetary unit of revenue that converts to net profit. This metric considers all operating costs and expenses, including direct and indirect costs such as production costs, administrative expenses, marketing, and taxes.
Calculate net profit margin regularly:
Perform the net profit margin calculation at regular intervals, such as monthly or quarterly. Tracking this metric over time will allow you to identify trends and variations in the financial performance of your business.
Compare the net profit margin to the industry benchmark:
Research and analyze the average net profit margin of the specialty coffee roasting industry. This will allow you to compare your business performance to the overall market performance and identify areas where you can improve.
Analyze the main causes of variation:
Identify the main causes of variation in net profit margin. This may include changes in production costs, increased operating expenses, fluctuations in selling prices, or any other factor that affects the profitability of your business. By identifying the causes, you can take appropriate corrective action.
Adjust sales prices if necessary:
If your net profit margin is below expectations of the industry benchmark, you may consider adjusting the prices of your specialty coffees. Evaluate market demand, customer perception of value, and competition to determine if a price adjustment is possible.
Control operating costs:
An effective way to improve net profit margin is to control operating costs. Review your operating expenses, identify areas of waste or inefficiency, and find ways to reduce costs without compromising product quality or customer service.
Pursue efficiency and automation:
Look for opportunities to increase efficiency and automate processes. This can help reduce operating costs, increase productivity, and improve the net profit margin. Consider investing in technologies and systems that can streamline your operations and reduce reliance on manual labor.
5 – Return On Investment (ROI)
Return on investment is a financial metric that measures the profitability of a specific investment. It indicates the percentage of return obtained about the amount invested. This metric is crucial to evaluate whether the investments made in your business are generating satisfactory returns and are aligned with your financial goals.
Identify the relevant investments:
Start by identifying the specific investments you want to evaluate. This could be the purchase of new roasting equipment, infrastructure improvements, marketing investment, or any other investment you have made in your specialty coffee roaster.
Calculate the return on investment:
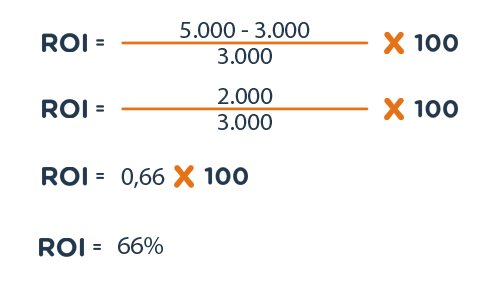
To calculate the ROI, you need to compare the gain made to the investment made. Subtract the cost of the investment from the gain generated by that investment and divide the result by the cost of the investment. Multiply the result by 100 to get the ROI percentage.
ROI = (Gain – Investment Cost) / Investment Cost * 100
Evaluate ROI against objectives:
Analyze the ROI achieved against the objectives set for the investment. This will allow you to determine whether the return is satisfactory and whether the investment is aligned with your financial goals. Also, consider the period over which the ROI was calculated to assess the rate of return over time.
Consider the payback time:
In addition to ROI, take into consideration the time it takes to achieve total return on investment. Investments with shorter payback times are generally preferred as they free up funds more quickly for other investments or for general use in the business.
Re-evaluate investments with low ROI:
If you identify investments with ROI below expected or below the industry benchmark, you need to reassess their effectiveness and viability. Identify the factors that may be negatively impacting returns and consider adjusting your strategy or reallocating resources to more promising investments.
6 – Break-even point
The break-even point is the sales level at which total revenue equals total costs, resulting in a net profit equal to zero. It is the point at which your company is making neither a profit nor a loss. Knowing your break-even point is key to understanding the minimum sales volume required to cover all your costs and expenses.
Calculate your break-even point:
The first step is to calculate your break-even point in terms of units sold or in terms of revenue. To calculate the break-even point in units, divide the total fixed costs by the unit sales price minus the variable costs per unit. To calculate the break-even point in revenue, divide the total fixed costs by the unit contribution margin (unit sales price minus variable costs per unit).
Analyze the results:
After calculating the break-even point, analyze the results obtained. Compare it to your current sales volume to determine whether your company is operating above or below break-even. If you are operating below break-even, this indicates that you are making a loss and need to increase sales or reduce costs. If you are operating above break-even, this indicates that your company is making a profit.
Identify growth opportunities:
By knowing your break-even point, you can identify growth opportunities. Determine the additional amount of sales needed to make a desired profit. This will help you set realistic sales goals and develop strategies to achieve them.
Make projections and simulations:
Use the break-even point as a tool to make financial projections and simulations. Adjust sales figures, prices, costs, and expenses to analyze the impact on break-even and profit. This will allow you to evaluate different scenarios and make more informed decisions about investments, cost reduction, or price increases.
Monitor it regularly:
Break-even is not one of the static metrics, so it is important to monitor it regularly as market conditions and business variables change. Update your break-even calculations based on changes in costs, prices, or product mix. This will ensure that you have an accurate picture of the financial health of your business.
7 – Inventory Turnover
Inventory turnover is a metric that measures the speed with which product inventory is sold and replaced over a given period. It is an important metric for evaluating the efficiency of inventory management, as it indicates whether products are being sold quickly or are sitting idle in inventory for too long.
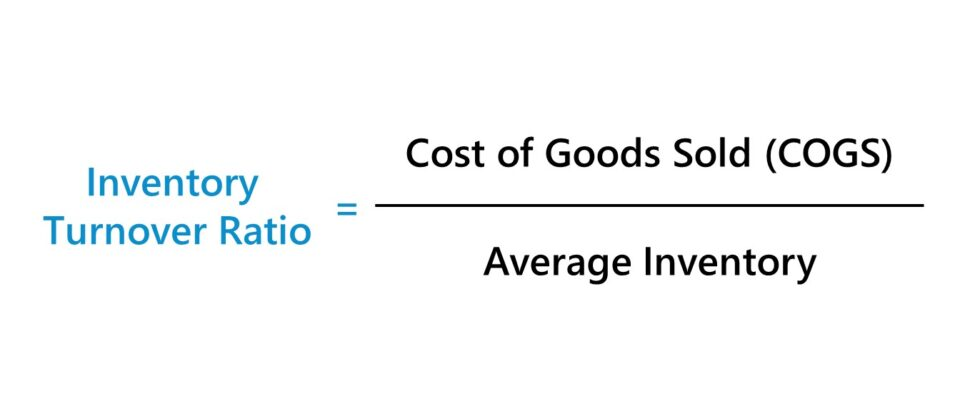
Calculate inventory turnover:
To calculate inventory turnover, divide the cost of sales by the average value of inventory over a given period. The result will be the number of times the stock is sold and replaced during this period.
Analyze the results:
After calculating the inventory turnover, analyze the results obtained. A high turnover indicates that products are being sold quickly, which is positive because it reduces the risk of obsolete or perishable products and increases cash flow. On the other hand, low turnover can indicate problems, such as stranded stock or difficulty attracting customers.
Identify products with a low turnover:
Use inventory turnover metrics to identify products that are experiencing low turnover. These products can be targeted for strategic actions such as promotions, price reductions, or product mix adjustments. Identifying and solving problems related to low inventory turnover will help optimize inventory management and increase profitability.
Track demand trends:
Monitor and analyze demand trends for your products. This will help you adjust inventory levels based on seasonality, customer preferences, and changes in the market. Closely tracking changes in demand will allow for more efficient inventory management, avoiding over- or under-stocking.
Improve demand forecasting:
Improve demand forecasting to avoid inventory problems. Use historical sales data, customer feedback, market trends, and seasonal information to improve the accuracy of demand projections. A more accurate demand forecast will help avoid stock-outs or overstocks, ensuring better control of inventory levels.
Optimize supplier management:
Maintain a strong relationship with your suppliers to ensure a continuous flow of products. Establish strategic partnerships, negotiate appropriate delivery times, and be aware of opportunities to obtain better commercial terms. Good supplier management can help reduce replenishment time by ensuring that products are available when needed.
We have reached the end of this blog for specialty coffee roasters on how to use financial metrics and indicators to evaluate the performance of your business. During this journey, we’ve explored several financial metrics, and discussed the importance of monitoring and interpreting these indicators to make informed strategic decisions.
By understanding and applying these metrics to your operation, you gain a clear picture of the financial health of your business. You can identify areas for improvement, take corrective action, identify growth opportunities, and boost the profitability of your company.
Remember that success in the business world is not only based on the quality of the coffee you produce but also on smart financial management. Financial metrics and indicators are powerful tools that provide valuable insights into your business performance, allowing you to make informed and strategic decisions.
Thank you for following us on this blog and we hope we have contributed significantly to your growth and success. Remember, knowledge is a powerful tool, and improving your skills in marketing, finance, and management is a valuable investment in the future of your specialty coffee roasting business.
We wish you a successful and fulfilling journey in your passion for specialty coffee!


